geointel
Revolutionising
Australian Real Estate Insights
Gain access to near real-time suburb data, critical analytics, and innovative insights. Uncover emerging market trends and investment opportunities to give you the edge in a crowded market.

Trusted by industry professionals across australia
In Market Cap Analyzed
National Geographical Suburb Coverage
Key Suburb Performance Indicators
Geocoded Addresses Accessed

NEXT-GEN REAL ESTATE INTELLIGENCE
Faster insights.
More context.
In Australia’s fast-moving property market, the difference between a good investment and a stellar one hinges on having timely and actionable insights. Traditional analytics often deliver delayed and surface-level information, failing to capture current market trends. Geo Intel bridges this gap with next-generation, in-depth suburb comparative tools that measure key performance metrics like never before.
Price-Smart Suburbs
Discover value at every price point, even on a modest budget. Whether you're a first-time buyer or a seasoned investor, our in-depth market insights help you identify the best opportunities for optimal returns.
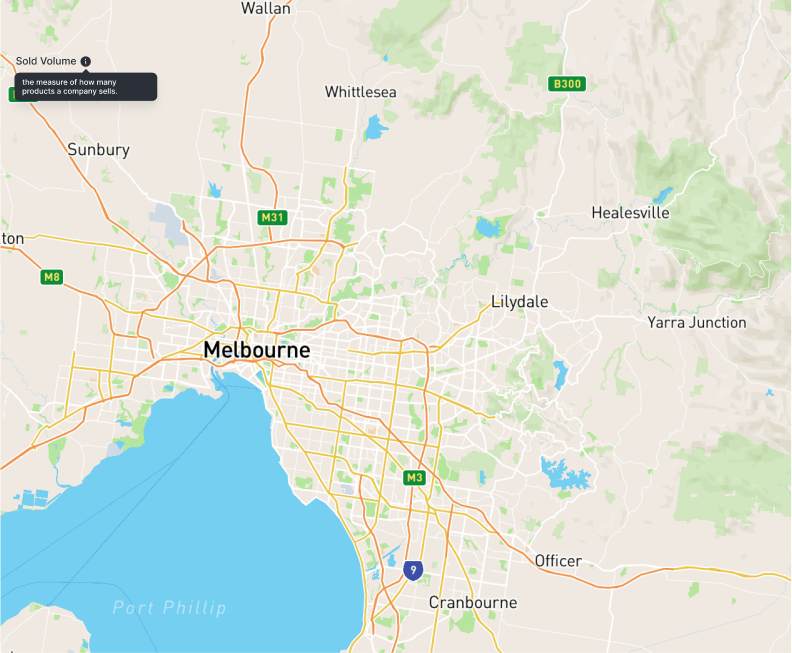
Exploratory Data Analysis
Experience suburb-level data in a revolutionary way with our continuously evolving 3D map visualisations. These advanced tools deliver unprecedented detail and context, enabling you to uncover trends that traditional table formats often overlook.
Comprehensive Insights
From in-depth property sales and rental data to room demand, socioeconomic status, population growth, and building approvals — each facet provides a rich layer of insight.
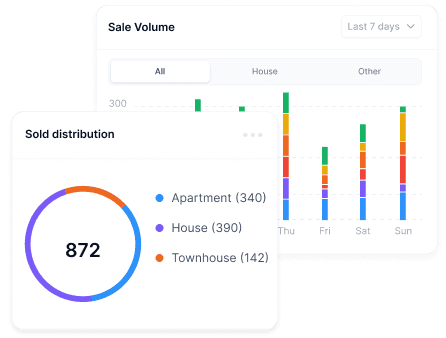
Analytics
Uncover Key Performing
Suburbs.
Discover top-performing suburbs with our intuitive set of performance tools, specifically designed to spotlight suburbs excelling in key metrics. Our approach goes beyond simply highlighting growth rates and rental yields but also identifies which specific property types and bedroom configurations are experiencing growth.

Rental Yield
Identify suburbs with highest returns by using our comparative analysis tool which tracks the rental yield of each suburb over the last 12 months, updated monthly.
Sales growth
Track year-on-year sales growth to gauge market activity, identify booming locations, and pinpoint emerging hotspots. This data enables you to capitalize on rising market trends effectively.
Price growth
Monitor year-on-year property value growth trends to pinpoint appreciating markets and changes in demand for specific property/bedroom types.
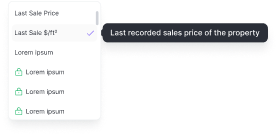
Price Per Meter
Stay equipped with detailed price per meter data for each property and bedroom configuration in every suburb. Investors can confidently navigate local markets, distinguishing favourable deals from less desirable ones.
Days on market
Track how long each specific property or bedroom type takes to sell across various suburbs over the last 12 months. Uncover trends and buyer preferences rarely accessible elsewhere.
Population growth
Monitor yearly population changes and observe the most densely populated areas to identify market trends and pinpoint areas of growing demand.

ADVANCE ANALYTICS
Pioneering Insights.
See What Others Don't.
Step into the forefront of real estate intelligence with our Plus+ tier, granting access to a highly specialised suite of analytical tools. Designed for discerning investors, developers, and investment advisors, it offers industry-leading, early market indicators with unprecedented levels of detail, providing you with the insights needed to stay ahead in the property market.
Track Latest Rental Changes
Access your favourite metrics in an exclusive 3-month rolling window for a more precise view of the latest market shifts. This shorter time frame, compared to the standard 12-month window, offers timely and relevant insights, empowering you to make strategic investment decisions based on the most current data.
Track Latest Rental Changes
Track rental price changes across all suburbs, property types, and bedroom configurations by comparing 3-month to 12-month shifts. This early indicator helps you spot undervalued areas where property prices have yet to reflect rising rents, offering insights into market sentiment and enabling strategic, well-timed investment decisions to maximise rental yields and future growth.
Real-Time Days On Market
Identify the fastest-selling property and bedroom types in each suburb by showcasing the average days on market over the latest three-month period. This data directly reflects current market sentiment, revealing areas with strong demand and high buyer interest.
Real-Time Rental Yield
Pinpoint suburbs with the highest returns driven by recent property sales and up-to-date rental rates. Discover undervalued areas where property prices have yet to reflect their potential, or take advantage of recent rent increases to maximize your return on investment.
Room Demand
Leverage our comprehensive, suburb-specific research that evaluates both the value and demand for individual rooms in shared accommodations. Highlighting areas with the highest market interest, offering key insights to strategically place or adjust your rental investments in high-demand locations.
Supply/Demand
Our supply-demand index combines high sales, low current listings, and days on market to reveal areas of intense demand and shortages. Revealing buyer's and seller's markets, highlights market momentum, and uncovers opportunities for price appreciation and developments.
Price Per Meter Growth
Track the six-month change in price per meter compared to the previous period to discover the true value and growth of a suburb. This uncovers hidden trends and transforms investment strategies. Explore investment strategies centred on price per meter yields to diversify your portfolio and enhance your returns per dollar.
Real-Time Price Growth
Compare the latest three-month median prices with annual medians to clearly identify areas with the highest price appreciations and assess the current market landscape. This near real-time data serves as a crucial benchmark, enabling you to confidently gauge current market sentiment and conditions.
FAQS
Frequently Asked Questions
Ready to get started?
Create an account today